使用堆快照
🌐 Using Heap Snapshot
你可以从正在运行的应用中获取堆快照,并将其加载到 Chrome 开发者工具 中以检查某些变量或查看保留者大小。你还可以比较多个快照,以查看随时间的差异。
🌐 You can take a Heap Snapshot from your running application and load it into Chrome Developer Tools to inspect certain variables or check retainer size. You can also compare multiple snapshots to see differences over time.
警告
🌐 Warning
在创建快照时,主线程中的所有其他工作都会停止。根据堆的内容,这可能甚至需要超过一分钟。快照是在内存中创建的,因此它可能会使堆大小增加一倍,导致占满整个内存,然后应用崩溃。
🌐 When creating a snapshot, all other work in your main thread is stopped. Depending on the heap contents it could even take more than a minute. The snapshot is built in memory, so it can double the heap size, resulting in filling up entire memory and then crashing the app.
如果你要在生产环境中进行堆快照,请确保你所进行快照的进程崩溃时不会影响应用的可用性。
🌐 If you're going to take a heap snapshot in production, make sure the process you're taking it from can crash without impacting your application's availability.
如何
🌐 How To
获取堆快照
🌐 Get the Heap Snapshot
有多种方法可以获取堆快照:
🌐 There are multiple ways to obtain a heap snapshot:
- 通过检查器,
- 通过外部信号和命令行标志,
- 通过进程内的
writeHeapSnapshot调用, - 通过检查器协议。
1. 在检查器中使用内存分析
🌐 1. Use memory profiling in inspector
适用于所有正在积极维护的 Node.js 版本
使用 --inspect 标志运行 Node 并打开调试器。
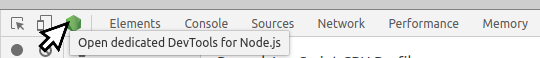
🌐 Run node with --inspect flag and open the inspector.
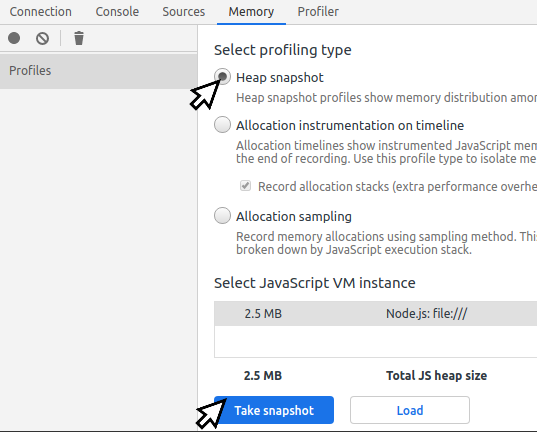
获取堆快照最简单的方法是将检查器连接到本地运行的进程。然后转到内存标签页并拍摄堆快照。
🌐 The simplest way to get a Heap Snapshot is to connect a inspector to your process running locally. Then go to Memory tab and take a heap snapshot.
2. 使用 --heapsnapshot-signal 标志
🌐 2. Use --heapsnapshot-signal flag
适用于 v12.0.0 或更高版本
你可以使用命令行标志启动 node,以便响应信号来创建堆快照。
🌐 You can start node with a command-line flag enabling reacting to a signal to create a heap snapshot.
$ node --heapsnapshot-signal=SIGUSR2 index.js
详情请参阅 heapsnapshot-signal flag 的最新文档。
🌐 For details, see the latest documentation of heapsnapshot-signal flag.
3. 使用 writeHeapSnapshot 函数
🌐 3. Use writeHeapSnapshot function
在 v11.13.0 或更高版本中有效 在较旧版本中可以与 heapdump package 一起使用
如果你需要获取正在运行的进程的快照,比如服务器上运行的应用,你可以使用以下方法来实现:
🌐 If you need a snapshot from a working process, like an application running on a server, you can implement getting it using:
('node:v8').();请查看 writeHeapSnapshot 文档 获取文件名选项。
🌐 Check writeHeapSnapshot docs for file name options.
你需要有一种在不停止进程的情况下调用它的方法,因此建议在 HTTP 处理程序中调用,或作为对操作系统信号的响应。要小心不要暴露触发快照的 HTTP 端点,其他人不应该能够访问它。
🌐 You need to have a way to invoke it without stopping the process, so calling it in a HTTP handler or as a reaction to a signal from the operating system is advised. Be careful not to expose the HTTP endpoint triggering a snapshot. It should not be possible for anybody else to access it.
对于 v11.13.0 之前的 Node.js 版本,你可以使用 heapdump 包。
🌐 For versions of Node.js before v11.13.0 you can use the heapdump package.
4. 使用检查器协议触发堆快照
🌐 4. Trigger Heap Snapshot using inspector protocol
Inspector 协议可以用于从进程外部触发堆快照。
🌐 Inspector protocol can be used to trigger Heap Snapshot from outside of the process.
无需运行 Chromium 的实际检查器即可使用 API。
🌐 It's not necessary to run the actual inspector from Chromium to use the API.
这是一个在 bash 中使用 websocat 和 jq 的示例快照触发器:
🌐 Here's an example snapshot trigger in bash, using websocat and jq:
#!/bin/bash
set -e

kill -USR1 "$1"
rm -f fifo out
mkfifo ./fifo
websocat -B 10000000000 "$(curl -s http://localhost:9229/json | jq -r '.[0].webSocketDebuggerUrl')" < ./fifo > ./out &
exec 3>./fifo
echo '{"method": "HeapProfiler.enable", "id": 1}' > ./fifo
echo '{"method": "HeapProfiler.takeHeapSnapshot", "id": 2}' > ./fifo
while jq -e "[.id != 2, .result != {}] | all" < <(tail -n 1 ./out); do
  sleep 1s
  echo "Capturing Heap Snapshot..."
done

echo -n "" > ./out.heapsnapshot
while read -r line; do
  f="$(echo "$line" | jq -r '.params.chunk')"
  echo -n "$f" >> out.heapsnapshot
  i=$((i+1))
done < <(cat out | tail -n +2 | head -n -1)

exec 3>&-以下是可与检查器协议一起使用的内存分析工具的非详尽列表:
🌐 Here is a non-exhaustive list of memory profiling tools usable with the inspector protocol:
如何通过堆快照查找内存泄漏
🌐 How to find a memory leak with Heap Snapshots
你可以通过比较两个快照来发现内存泄漏。确保快照差异中不包含不必要的信息非常重要。按照以下步骤应能生成快照之间的干净差异。
🌐 You can find a memory leak by comparing two snapshots. It's important to make sure the snapshots difference does not contain unnecessary information. Following steps should produce a clean diff between snapshots.
- 让该过程加载所有资源并完成引导。最多应只需几秒钟。
- 开始使用你怀疑会泄漏内存的功能。它可能会进行一些初始分配,这些分配并不是导致内存泄漏的那部分。
- 拍摄一次堆快照。
- 继续使用该功能一段时间,最好在此期间不要运行其他任何程序。
- 再拍一次堆快照。两个快照之间的差异主要应该包含泄漏的内容。
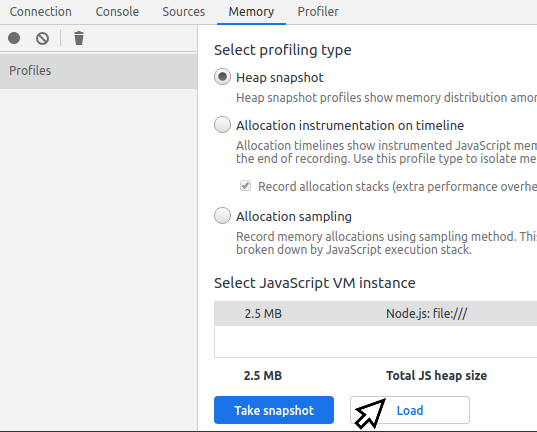
- 打开 Chromium/Chrome 开发者工具并进入 内存 标签
- 请先加载较旧的快照文件,然后再加载较新的快照文件。
- 选择较新的快照,然后在顶部的下拉菜单中将模式从 摘要 切换到 比较。
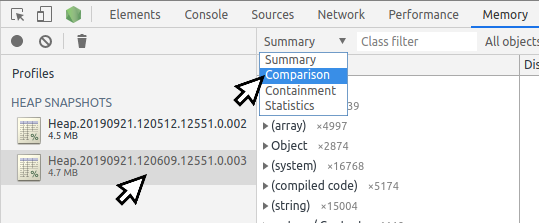
- 在底部面板中查找大的正增量,并探索导致它们的引用。
你可以通过这个堆快照练习来练习捕获堆快照和查找内存泄漏。
🌐 You can practice capturing heap snapshots and finding memory leaks with this heap snapshot exercise.